Imagine we find a habitable planet next to our nearest star which wasn’t the sun. That would be Proxima Centauri and it is approximately 4.2 light years away from us.
What follows next is a gross oversimplification of space travel.
If we assume that we could travel through space at a speed of 56,000 km/h, it would take 81,000 years to reach the planet. We of course decide to colonise it but we can’t live for 81,000 years — the current world average life expectancy is 70.5 years. So, let’s assume our next best idea is to go there by using a generational ship. Those aboard will live and die on the ship, giving birth to the next generation along the way until the last generation reaches the planet.
Would we do it?
81,000 years is obviously a long time and the first people going aboard the ship are making choices based on their current technology. What if 43,587 years later, those back on earth discover new technologies which allows them to colonise the planet within 20 years. The offspring of those who boarded the generational ship would not reach the planet first, which was the main reason to go. With this in mind, would anyone choose to board the ship in the first place?
These are the kind of issues which exist for companies making investment decisions. Because it takes time for the benefits of investment to show, it can be rendered useless by better, cheaper technology. Could this sort of thinking be discouraging businesses from making investments?
Why is investment important?
Investment is what allows me to write this post on a laptop instead on pen and paper. It’s what allows me to research this topic on the internet instead of sifting through a mountain of books. It’s also what allows you to read this post anywhere without carrying around pieces of paper. Somewhere, sometime ago, someone thought about these new ways of doing things and an investment was made to turn these new methods of doing, into products.
Investment helps raise an economy’s capital stock, which is another way of saying it increases the number of tools we can work with. These new tools and technologies make an impact on our productivity — how much we’re able to get done with the same amount of inputs. This includes investment in education where knowing more allows us to do more or do things in a better way.
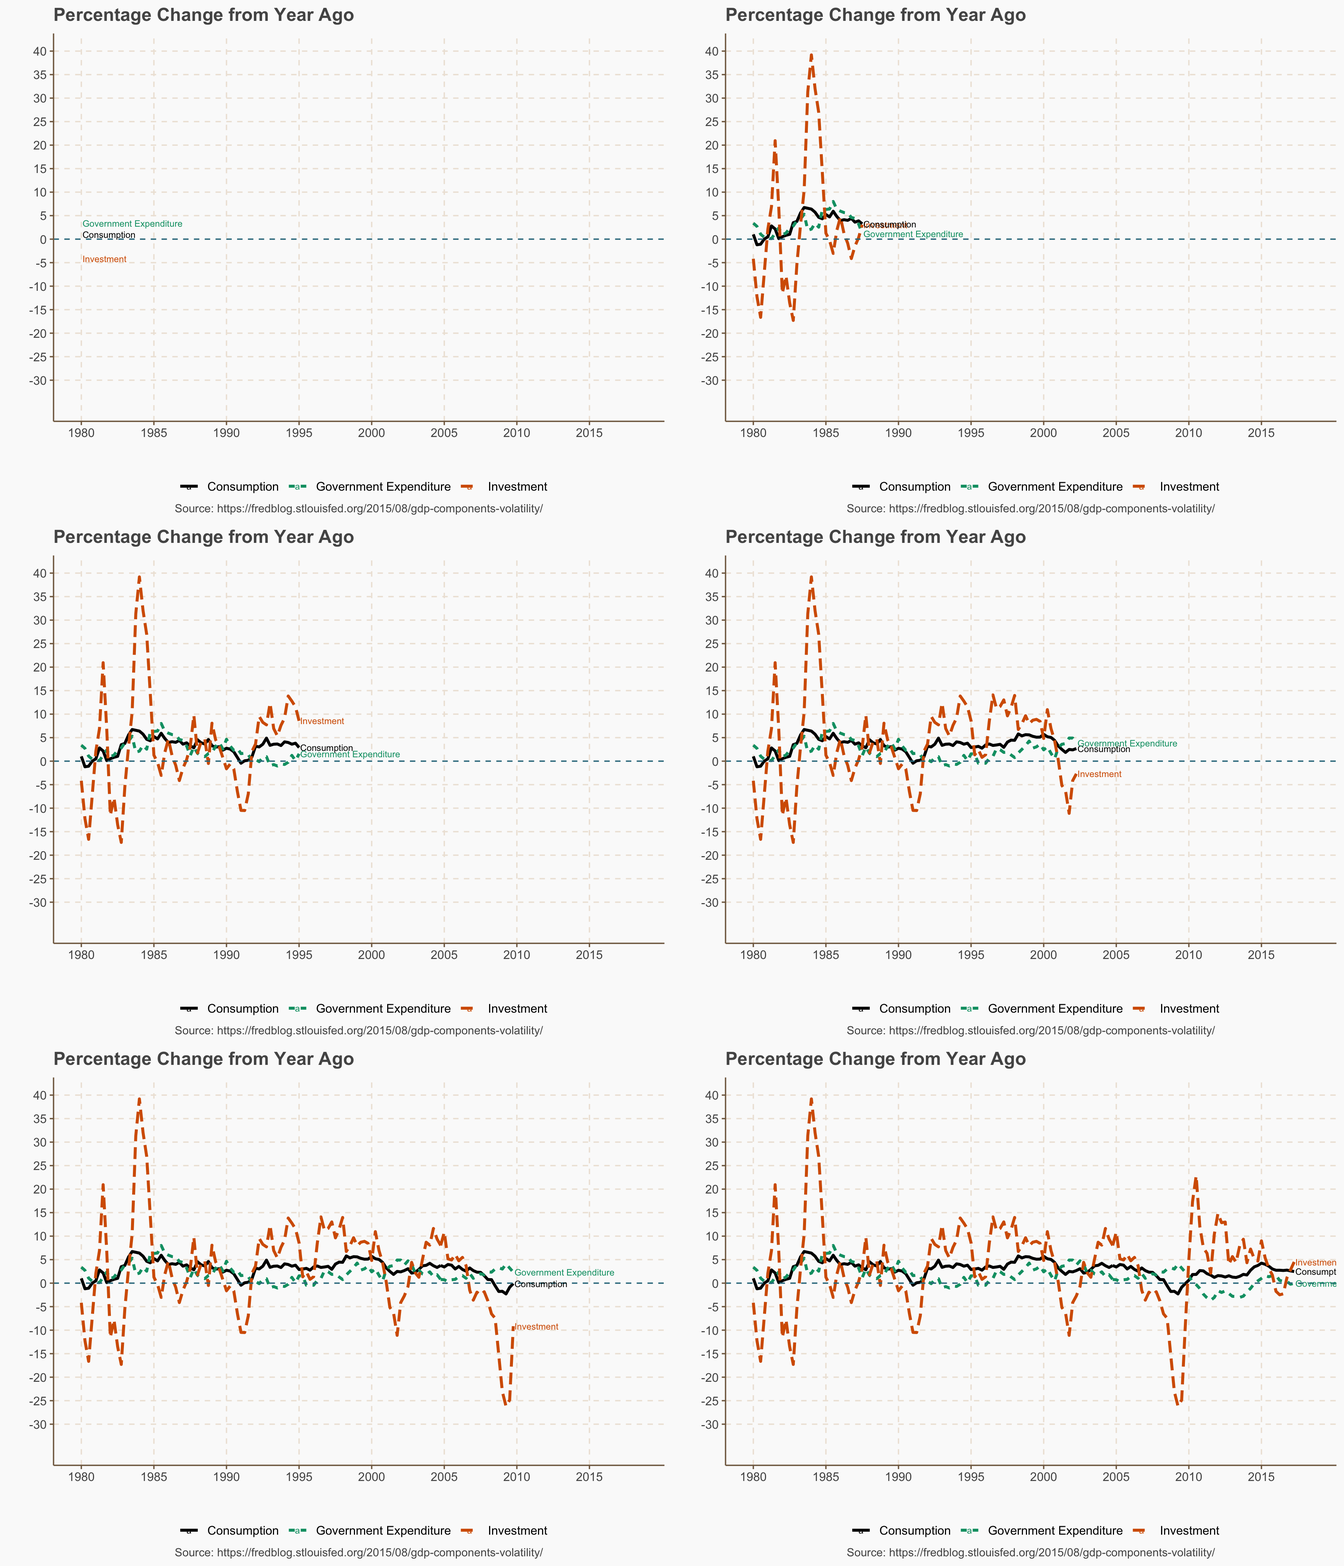
As a component of GDP, measuring investment helps us to measure an economy’s output. It’s the most volatile component as the animation below shows — it rises and falls by larger amounts.

Click here for the graph code created with R
This volatile behaviour can be explained by how optimistic firms are about the future and investment decisions being optional. You need to buy food and pay for shelter regularly to sustain yourself but you don’t need to buy a new machinery for your business or learn a certain skill if you think it’s going to be worthless to you. Even if you plan to invest, future outcomes are uncertain. With the gains of investment being realised in the long term, it’s not a surprise that investment activity is sensitive to this uncertainty.
What’s happening with business investment?
Both Gross and Net (which takes into account depreciation) investment as a share of GDP reached 14.6% and 4.8% respectively at the peak of the 90s boom. Since then, both are yet to reach similar numbers with average gross and net investment since 2000 being 12.7% and 2.6% respectively. Gross investment has been sluggish in this period but net investment has had a downward trend.

However, these are nominal ratios, which means any price effects aren’t striped out. Over the decades, we’ve seen Moore’s law in action, where the number of components packed into a computer chip has doubled every 2 years or so. This has meant new computers and other technologies have doubled in speed and have become more powerful at lower costs. In the 1970s, supercomputers were bulky, stationary things which used up a lot of power. Supercomputers can now be found in our pockets.
Why does this matter? Because most of investment is being spent on things which have benefitted from this reduction in costs.
While investment in equipment makes up the bulk of total investment, investment in intellectual products, which include software and research and development, is making up a growing portion of total investment. Also, the bulk of investment in equipment is being driven by information processing equipment, which includes computers and communication equipment.


It therefore makes sense to look at the real ratios of investment to gdp to see if the nominal figure was just capturing falling costs. I use log ratios to avoid misinterpreting chained dollar ratios as this article explains. I then use the log ratio and express it relative to a base year value (1967 in my case) as explained here, to get the cumulative percentage changes. A percentage shows a part of the whole. Meanwhile, a cumulative percentage is derived from adding a percentage from one period to a percentage from the next period which will help us see if the part (Gross and Net Investment) of the whole (GDP), have become more or less important over the years.
If this ratio falls below 0, then the real investment growth has cumulatively fallen short of cumulative real GDP growth. We see this happen frequently with net investment but not with gross investment. However, both gross and net investment have grown cumulatively relative to GDP since 1967, growing at 73% and 23% respectively.

There’s been a growing gap between the gross and net cumulative growth rates since the early 2000s. In fact, if we change the starting point to this period, we find that net investment has cumulatively fallen short of cumulative GDP growth.

If we then look at net investment as a share of gross investment, we discover that it’s been falling steadily in nominal and real terms.


This suggests a greater amount of investment is being devoted to replacing older capital stock instead of adding to stock. What could explain this?
Fool me once
Firms who invest are not capturing most of the benefits. This is a point raised by William Nordhaus who finds profits from innovation are small. Why? Nordhaus says most of the innovation happening in the new economy — software, telecommunications, and similar industries — are marked by easy entrance and exit. These industries are also characterised by rapid technological change. What is usually valuable in these industries is the information or know-how created from these innovations and as Nordhaus says,
“ The economic nature of information is that it is expensive to produce and inexpensive to reproduce. Indeed, with the internet, it is often essentially free to reproduce and distribute vast amounts of information. The low costs of imitation, transmission, and distribution of information technologies are likely to erode the value of property rights in intellectual property and reduce the durability of Schumpeterian profits in the new economy. ”
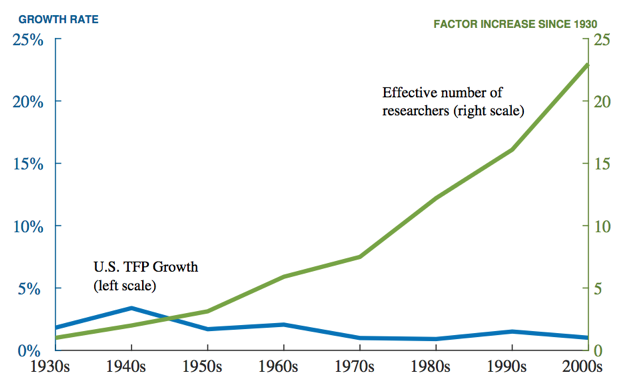
Nordhaus studied this at the height of the 90s tech boom but Nicholas Bloom et al find that producing ideas has only got more expensive in comparison to the slowdown in productivity growth. They measured economy wide research input and found that this has been increasing dramatically while productivity growth has been slowing down. More researchers are needed now to produce the same amount of ideas.
 Reference: https://cepr.org/voxeu/columns/ideas-arent-running-out-they-are-getting-more-expensive-find
This finding is not only evident on the aggregate but shows up in different industries and products.
“ Our research shows that this pattern holds across a range of case studies. Whether we look at crop yields for corn and soybeans, or medical innovations that reduce mortality from heart disease and breast cancer, we find a similar trend. There have been technological improvements, but these require the devotion of ever-growing amounts of resources to the research process to maintain steady rates of improvement. ”
Meanwhile, Wes Grey and Jack Vogel survey the academic research on the returns to investment. When higher asset growth was used as a proxy for investment in a paper by Cooper, Gulen, and Schill, they found that lower asset growth firms had higher future returns. This result still stuck when other determinants of returns where taken into account.
“ Over the past 40 years, low asset growth stocks have maintained a return premium of 20% per year over high asset growth stocks. The asset growth return premium begins in January following the measurement year and persists for up to five years….In the cross-section of stock returns, the asset growth rate maintains large explanatory power with respect to other previously documented determinants of the cross-section of returns (i.e., size, prior returns, book-to-market ratios). ”
Grey and Vogel then turned to a paper by Kewei Hou, Chen Xue, and Lu Zhang examining the investment factor directly and this paper also came to the same conclusion.
So, not only is investment in the new economy resource-intensive, investment in general has a bad record in terms of returns. In realising this, maybe businesses may have wised up and would prefer to wait it out before deploying funds towards investments.


